
You’ve just finished writing your 1000-page-long code for a master project you’re working on. That air of satisfaction that it’s finally done and you’ve done it brings a wide smile.
But that smile gets inverted as soon as you press execute. The compiler shows 100+ errors, changing your momentary satisfaction into a sigh.
We understand your pain, and we’re here to the rescue! Although Yoda’s words are very wise, your project still needs completion.

Debugging can prove tricky, time-consuming, and frustrating. So, we’ve gathered some amazing tips to help you debug like a pro, and a secret weapon that will help you debug in two clicks!
If you’re new to debugging, we’ve covered everything from the basics to kickstart your debugging journey. So let’s get started!
What is Debugging?
Debugging is the process of removing code errors. It involves finding, isolating, and fixing bugs in source code in computer programs, software, or systems.
It is a computer engineering process in software development that defines the best approach to solving application problems.
Debugging is like solving a hard puzzle. When a few pieces don’t fit, you see where you went wrong and try a different approach. Similarly, you understand what went wrong with your code when you debug, finding where the “pieces” don’t fit!
When there are unexpected behaviors or when the program doesn’t work as intended, debuggers study the code to identify why the error occurred and resolve them.
So, what is a debugger?
A debugger is either a software professional or a software tool who/that tests your program to identify the errors and bugs. They are your detectives, using their magnifying glasses to solve the ‘bug mystery’.
Understanding Where Errors Come From
Having an understanding of the source of error in coding is essential. This will enable proper debugging and raise the code quality. In general, we classify errors as human, machine, or procedural.
Let’s have a closer look at each category.
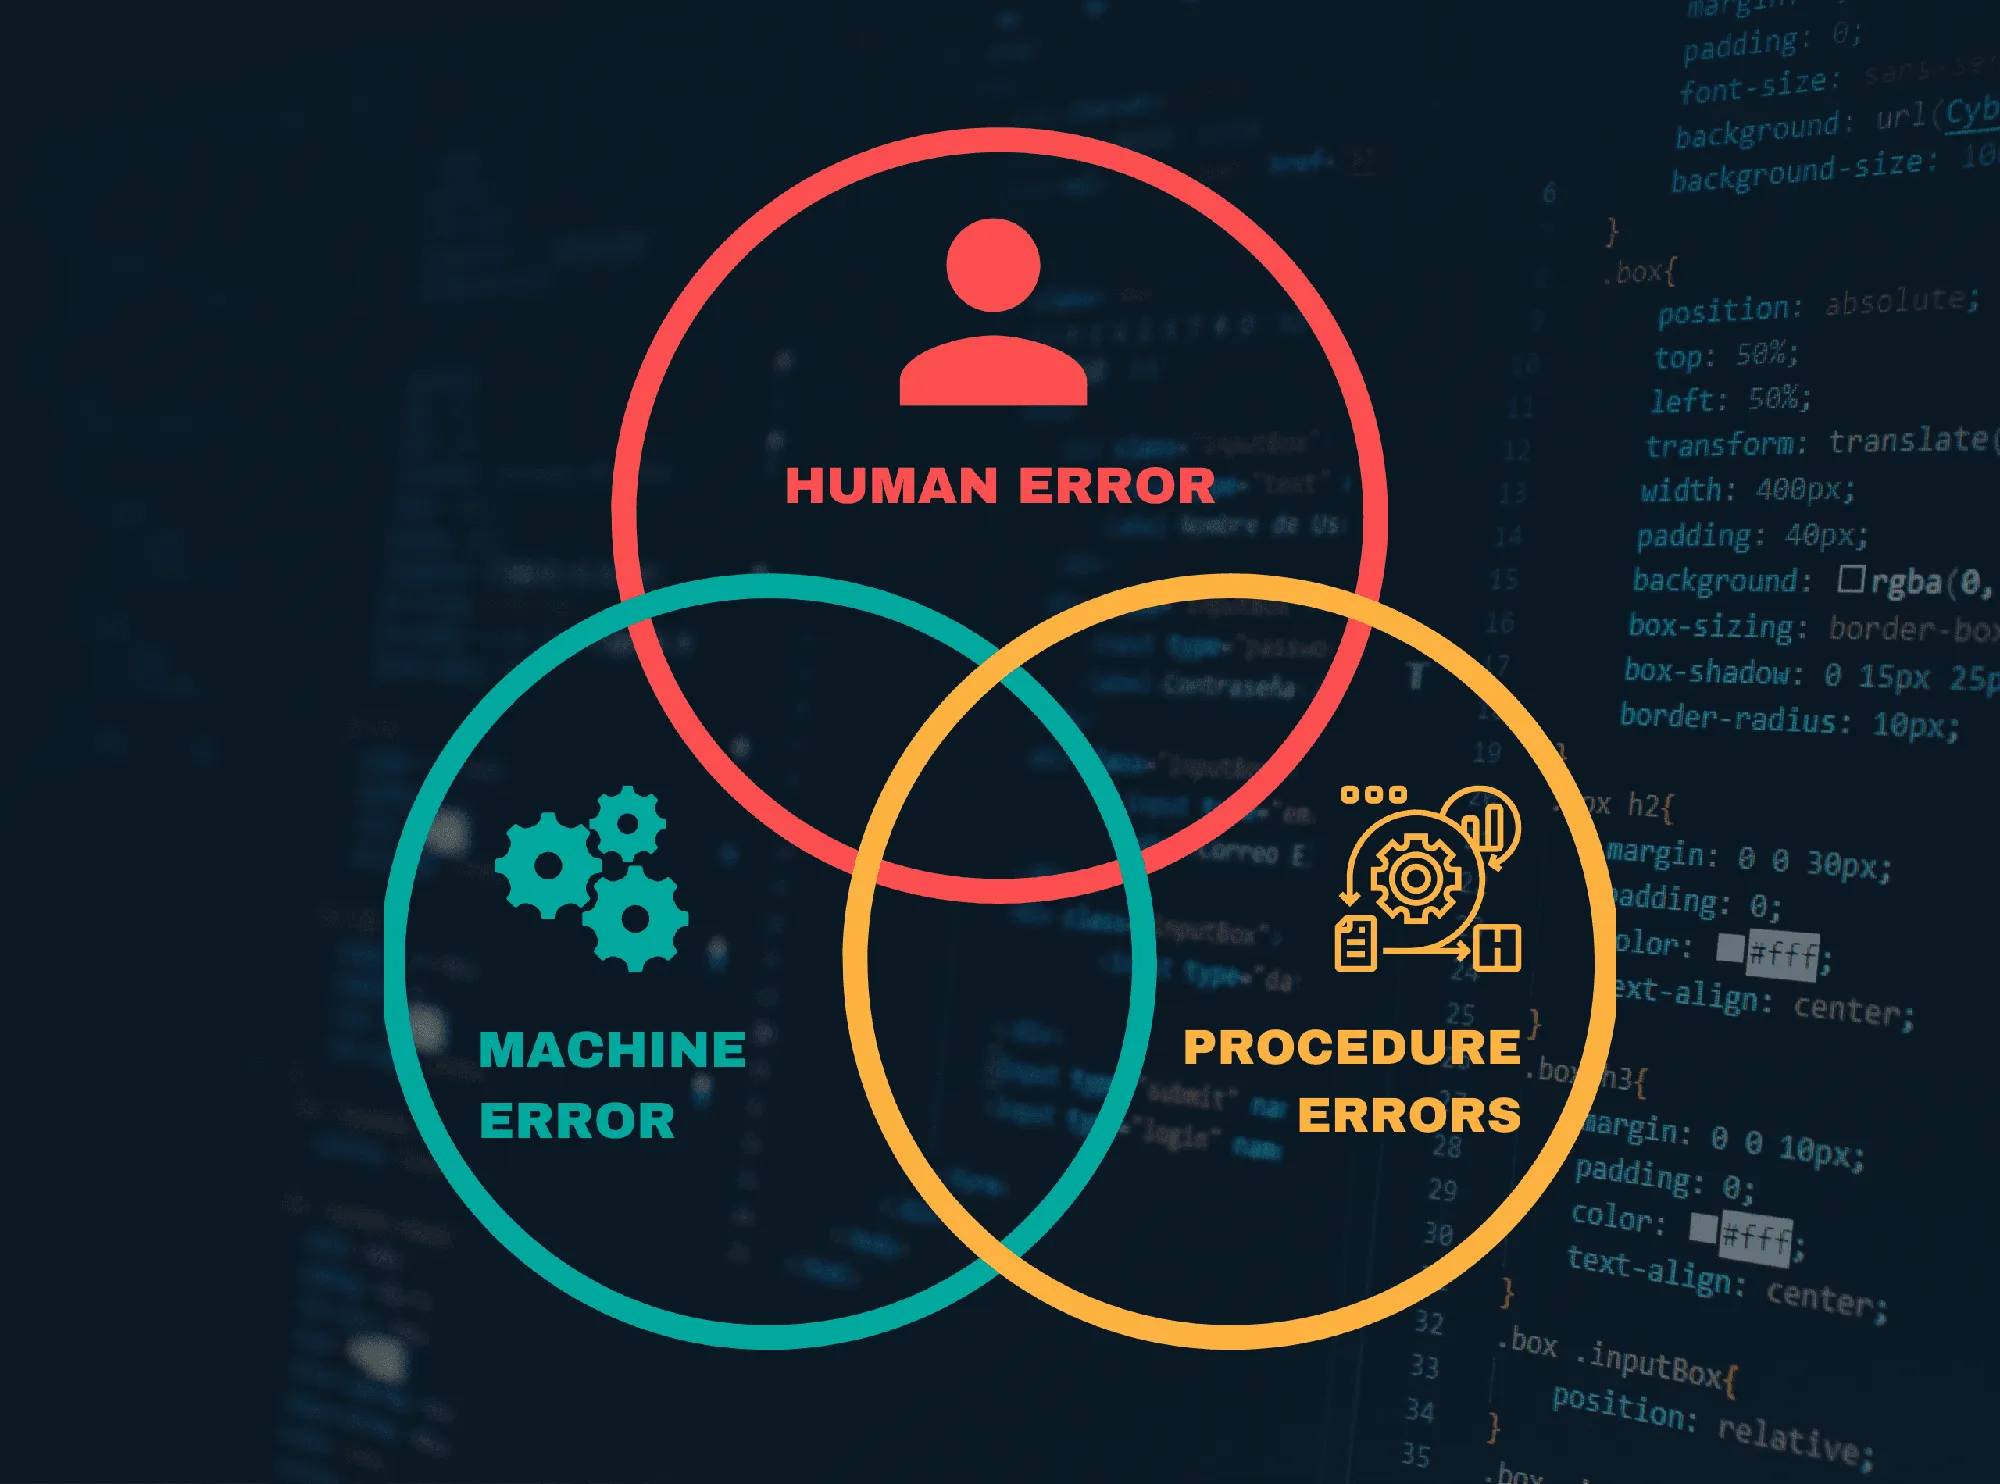
Human Errors
These are mistakes committed by the programmer either due to misunderstanding or knowledge gaps. This can be syntax errors, typographical mistakes, or logical errors (we will understand coding errors further below).
For example, a developer might not know how a function should work. So, they might wrongly implement one. This can create unexpected behavior.
Machine Errors
These are errors that arise from either a limitation or a failure of the hardware that the code is supposed to run on.
One classic example is a program running out of memory since it has to load a huge data set into the RAM at once. Another example is insufficient storage space causing a program to crash when it tries to write data to disk.
Procedural Errors
Procedural errors arise because the developers don’t follow coding or method standards. This can lead to code being difficult to maintain or to be extended.
For example, forgetting to include MVC (Model-View-Controller) in web development would create a rigid system. It would have everything coupled, mixing business logic with its presentation layers.
Types of Coding Errors
Errors are a part of coding, much like Tom and Jerry. However, knowing the different types of errors helps deal with these effectively. Understanding the various types of errors helps diagnose and fix them efficiently.
By categorizing the error, developers can streamline specific strategies against the nature of the bug. Let’s dig deeper into the three types of coding errors.
Syntax Errors
The programmer makes syntax errors by violating the grammatical rules of a programming language. Most of these mistakes are easily visible and can be corrected because they are flagged either at the time of code writing by most Integrated Development Environments (IDEs) or during compilation by the compiler.
An example of a syntax error is missing a semicolon at the end of a line in a language such as Java or C++.
Logic/Semantic Errors
Logic errors originate from the syntax of the code being correct, but different output than what the programmer intended. They are much more insidious since the program does not crash, so it is harder to find.
For example, setting a loop to terminate much earlier than expected may lead to not all the list elements having been processed, hence giving an erroneous result.
Another common example is using the wrong operator in a conditional expression, leading to a logic flaw.
Runtime Errors
Runtime errors occur during the program’s running, mostly under unforeseen conditions. This can arise when the developer is trying to access a non-existing file or lacks accessible network resources.
For example, the “Division by zero” might be invisible while coding or even testing. But when executed, it will crash the program.
How to Debug Your Code
Step-by-Step Debugging Process
Here’s a stepwise guide to debugging your code:
Gather Error Information
You are the detective at an active crime scene. Your first step is gathering evidence. In your bug-filled code, this means collecting error messages, user reports, and any anomalies in the behavior of your program.
Isolate the Error
Just narrow down where your problem lies like you’d narrow down the suspects. Set up a controlled environment in which you will be able to reproduce the error.
For example, if a file upload is failing in your program, try to narrow down which part of the code specifically handling the upload. You can even use commenting-out sections to see if other problems persist.
Identify the Error
Like the wise Sherlock said, “When you have eliminated the impossible, whatever remains, however improbable, must be the truth.”

This step is like piecing together the clues to form a coherent picture of what went wrong.
Once your suspects are lined up, it’s time to point the finger at the culprit. Look at the isolated code and figure out what it is doing there, or even why. Taking the example of file upload, the issue can be that the file is too large, or maybe it’s an incompatible file format.
Determine How to Fix the Error
Armed with the knowledge of the problem, prepare to develop a plan on how to solve it. In the file example, you might need to adjust your program to handle larger files or support other file types, etc.
This is where you, the detective, plan on how to catch the criminal!
Apply the Fix and Test
Implement your solution and check if the error gets fixed. Like a relentless detective, never resting before the suspect is behind bars, don’t stop until you see your fix in action, solving the problem. Remember to test under various conditions to ensure the fix is robust.
Debugging Techniques
Here we will explore some debugging methods with code examples:
Using Print Statements
The simplest way to observe your code’s behavior during runtime is through print statements. By printing the values of variables, you easily verify that certain sections of your code execute and receive instant feedback.
Here’s a simple example:
def find_average(numbers):
   total = sum(numbers)
   print(f"Total: {total}")  # Debugging print statement
   count = len(numbers)
   average = total / count
   return average

print(find_average([1, 2, 3, 4, 5]))
Try this code out in the Python IDE.
Error Handling
Error handling means structuring code in such that it anticipates errors and deals with them gracefully. This helps in the robust application performance and user experience.
try:
   number = int(input("Enter a number: "))
   inverse = 1.0 / number
except ValueError:
   print("You didn't enter a valid integer.")
except ZeroDivisionError:
   print("Infinity! Entered number is zero, which cannot be inverted.")
else:
   print(f"Inverse: {inverse}")
Commenting Out Code
By commenting out, it becomes possible to temporarily turn off parts of your code to isolate the section that causes the error; this helps try to find a problematic snippet in a large codebase.
# Assume this part is causing errors, so we comment it out to isolate the issue
# print("This line is causing an error")
print("This line works fine")
Writing and Running Tests
Automated tests catch errors before production. You can carry out automation testing through unit tests to cross-verify the individual part of the program. Then you can perform integration testing to check the working of components together.
import unittest
def add(a, b):
   return a + b
class TestAddition(unittest.TestCase):
   def test_add(self):
       self.assertEqual(add(1, 2), 3)
if __name__ == '__main__':
   unittest.main()
Consulting with Peers
When you hit a wall, talking to your colleagues might provide you with fresh insights you’ve overlooked or missed. This approach might make you see errors from another view, and probably you will correct mistakes faster.
Debugging Mindset
Pay Attention to Error Messages
Error messages are the first clue of what went wrong. Don’t simply scan over these, but read and understand them. They’ll tell you something about the nature and location of the problem.
For example, an error message like “IndexError: list index out of range” from Python informs you that you were trying to access an element in the list, explicitly, which does not exist, right down to that part of your code.
Search Engines for Solutions
Don’t reinvent the wheel! You will rarely find a problem that somebody else hasn’t run across before. Use the search engines to search for the exact error messages or describe the problem.
You can also search Stack Overflow or other programming communities to understand the problem better and get the solution.
For instance, the question on “TypeError: ‘NoneType’ object is not iterable python” can guide one to similar discussions and solutions on a topic where one is trying to iterate over an object that is None.
Rubber Duck Debugging
This is a famous debugging technique where you explain your code line-by-line to an inanimate object or the rubber duck. This method can help you gain new insights or even help bubble up logic flaws that you might have overlooked.
Taking Breaks for Fresh Perspectives
Take a short break from your code. It might refresh your mind and might take a completely different look at the problem. Sometimes, the solution pops up as soon as you stop actively thinking about it.
Ensuring the Bug is Truly Fixed
Here’s how to finalize your victory over a bug:
Verifying the Bug is Resolved
First, check the bugs that you found are resolved. You can ensure this by revisiting the conditions where you found the bug and testing it. This step might look trivial but can prove effective for providing you with that surety.
Testing for Unintended Side Effects
Sometimes fixing your code in one place might create bugs in another code snippet, causing your code to break again. Here are some strategies to ensure a complete bug fix:
Regression Testing
Run your full suite of automated tests to catch any regressions. The test suite caught regressions from your fix, but if, in that process, another problem was introduced somewhere else, your regression tests will catch that before it becomes your users’ problem.
Code Review
Let another pair of eyes look at the changes you make. Sometimes a fresh pair of eyes may notice something you’ve missed or suggest for you how to improve your solution.
User Acceptance Testing (UAT)
Whenever possible, let the real users test the changes in their environment to confirm that the fix meets their needs and does not break other things.
Monitor Logs and Feedback
After deploying your fix, carefully monitor logs, error reports, and feedback from users about new or repeating issues. Real-time insight can be very valuable here.
Writing Clean Code to Minimize Bugs
Writing clean code is the baseline for developing a less-bugged and maintainable, scalable, and understandable software for others (and yourself in the future). Clean code practices help in easy debugging and not only improve the development experience but also the whole product in every aspect.
Here are the effective ways to inculcate these principles:
Principles of Clean Coding
Make your code readable and clear. All of the above should also consist of meaningful variable names, functions, and methods that specifically express your intentions and exactly what those constructs are doing.
Avoid naming your variables with cryptic abbreviations, which might make sense only to you, or multi-clause expressions that obfuscate the logic of your code.
Have a single and consistent coding style in your project, including conventions about naming, spacing, and organization, helping greatly to improve the level of readability and maintainability.
DRY (Don’t Repeat Yourself) Principle
This is DRY’s core principle, exactly: your repetitive sections of code make your code base larger, harder to maintain, and with a greater potential for error because any change has to be propagated through all the duplicates.
For example, if ever you find yourself writing the same sort of code that validates your user inputs at multiple places, then you know you need to encapsulate this logic in one function and reuse that function.
Writing Simple Code
Avoid complication, and seek simplicity. Complicated code is never easy to read, nor easy to understand, and even more so for debugging. When you have a problem to face, first find the easiest solution to get the job done.
Use language-specific functions and libraries that abstract complexity. Stick to high-level methods of data manipulations, like those offered by the Pandas library in Python, rather than parsing and hand-manipulating your way through complex data structures.
Following SOLID Principles for Object-Oriented Design
The SOLID principles guide software architecture design in object-oriented programming to be manageable and system-scalable.
- Single Responsibility Principle (SRP): A class should have only one reason to change, whereby it focuses on one aspect, and hence the follow-up of the class for testing and understanding becomes easy.
- Open/Closed Principle (OCP): It says that the entities are open to their extension but closed for any of their modifications. It thereby encourages extending behaviors in a class without modifying the source code of the class, hence enhancing flexibility in evolving software systems.
- Liskov Substitution Principle (LSP): Subtypes should be substitutable for their base types without any change in the desired behavior of a program. This principle states that an object of a class, in a hierarchy, should be able to replace any other object of the same hierarchy, and the program should still work correctly.
- The Interface Segregation Principle (ISP) is a principle that says that the number of special interfaces is better than one general interface, and it is argued that this will reduce side effects in the changes and avoid forcing a class to implement methods that it does not use.
- Dependency Inversion Principle (DIP): High-level modules should not depend on low-level modules, but both should depend on the abstractions. In this case, the abstractions should not depend on the details, but rather this minimizes coupling between classes and system components.
Example of SOLID in Action
If you need to write messages to a file, then it’s possible to implement a logger system. Supposing there is the following interface (or abstract class) ILogger which determines a method logMessage.
If your code adheres to another example of the OCP and DIP principles, then you have different classes doing the logging: FileLogger, and DatabaseLogger, which can change independently of the rest of your application.
Are the Above Techniques Too Much? Here’s a One-Step Solution!
Did we overwhelm you with the information or do you still find debugging boring, monotonous, and time-consuming? If your answer is still yes, we have a one-step solution for you to debug any code snippet with an explanation!
Presenting JDoodle AI, the AI coding companion from JDoodle. Jdroid is the ChatGPT for developers, assisting devs to become more efficient in their coding journey.
You will find JDoodle AI nested in our IDE and it will not only help you debug, but will also help you generate code, generate comments, optimize your code, and much more!
To debug your code with JDoodle AI, paste your buggy code in JDoodle IDE. Then, go to JDoodle AI and select “Debug Code”. If you need an explanation, you can also select “Explain Code.”
That’s it! Your debugging process is complete!
You can use JDoodle AI with a FREE JDoodle account (no credit card needed) and get 10 AI daily prompts. By upgrading to a paid account, you can get 200 daily AI prompts.
Try out JDoodle AI for debugging and let us know what you think.
Frequently Asked Questions (FAQs)
What is Rubber Duck Debugging?
Rubber debugging technique is where you explain your code line-by-line to an inanimate object or the rubber duck. This can help you gain new insights or even help bubble up logic flaws that you might have overlooked.
What are the steps of debugging?
Debugging involves 5 steps, starting from gathering information, isolating the code snippet by commenting out, identifying the error, determining how you can fix it, and then fixing and testing out.
How do I manually debug code?
You can manually debug the code using debugging tricks and techniques, like rubber duck debugging, reading the errors that occurred, consulting online communities, and following a guided 5-step debugging process.
How do I debug code in one step?
You can use JDoodle AI, JDoodle’s AI to debug your code in two clicks. JDoodle AI can also explain the error in the code besides debugging your code and perform other coding functions like code generation, optimization, completion, and so on.